
AZ-500 is continuing with the following:
- Create and customize alert rules by using Azure Monitor
- Configure diagnostic logging and log retention by using Azure Monitor
- Monitor security logs by using Azure Monitor
- Create and customize alert rules in Azure Sentinel
- Configure connectors in Azure Sentinel
- Evaluate alerts and incidents in Azure Sentinel
Table of Contents
What is Azure Monitor?
Azure Monitor is a service in Azure that provides performance and availability monitoring for applications and services in Azure, other cloud environments, or on-premises. Azure Monitor collects data from multiple sources into a common data platform where it can be analyzed for trends and anomalies. Rich features in Azure Monitor assist you in quickly identifying and responding to critical situations that may affect your application.
Microsoft combined Azure Monitor, Log Analytics, and Application Insights into a single service to provide powerful end-to-end monitoring of your applications and the components they rely on.
There is no limit to the amount of metric data you can collect, but this data is stored for a maximum of 93 days. See Retention of Metrics.
Insights and curated visualizations
The experiences collect and analyze a subset of logs and metrics and depending on the service and might also provide out-of-the-box alerting. They present this telemetry in a visual layout. The visualizations vary in size and scale. Some are considered part of Azure Monitor and follow the support and service level agreements for Azure. They are supported in all Azure regions where Azure Monitor is available.
What products can you integrate?
The other services and older monitoring solutions in the following table store their data in a Log Analytics workspace so that it can be analyzed with other log data collected by Azure Monitor.
| Product/Service | Description |
|---|---|
| Azure Automation | Manage operating system updates and track changes on Windows and Linux computers. See Change Tracking and Update Management. |
| Azure Information Protection | Classify and optionally protect documents and emails. See Central reporting for Azure Information Protection. |
| Defender for the Cloud (was Azure Security Center) | Collect and analyze security events and perform threat analysis. See Data collection in Defender for the Cloud |
| Microsoft Sentinel | Connects to different sources including Office 365 and Amazon Web Services Cloud Trail. See Connect data sources. |
| Microsoft Intune | Create a diagnostic setting to send logs to Azure Monitor. See Send log data to storage, Event Hubs, or log analytics in Intune (preview). |
| Network Traffic Analytics | Analyzes Network Watcher network security group (NSG) flow logs to provide insights into traffic flow in your Azure cloud. |
| System Center Operations Manager | Collect data from Operations Manager agents by connecting their management group to Azure Monitor. See Connect Operations Manager to Azure Monitor Assess the risk and health of your System Center Operations Manager management group with Operations Manager Assessment solution. |
| Microsoft Teams Rooms | Integrated, end-to-end management of Microsoft Teams Rooms devices. |
| Visual Studio App Center | Build, test, and distribute applications and then monitor their status and usage. See Start analyzing your mobile app with App Center and Application Insights. |
| Windows | Windows Update Compliance – Assess your Windows desktop upgrades. Desktop Analytics – Integrates with Configuration Manager to provide insight and intelligence to make more informed decisions about the update readiness of your Windows clients. |
| The following solutions also integrate with parts of Azure Monitor. Note that solutions, are no longer under active development. Use insights instead. | |
| Network – Network Performance Monitor solution | |
| Network – Azure Application Gateway Solution | . |
| Office 365 solution | Monitor your Office 365 environment. Updated version with improved onboarding available through Microsoft Sentinel. |
| SQL Analytics solution | Use SQL Insights instead |
| Surface Hub solution |
Azure supported services
The following table lists Azure services and the data they collect into Azure Monitor.
- Metrics – The service automatically collects metrics into Azure Monitor Metrics.
- Logs – The service supports diagnostic settings which can send metrics and platform logs into Azure Monitor Logs for analysis in Log Analytics.
- Insight – There is an insight available which provides a customized monitoring experience for the service.
Azure Monitor Agent
Does Azure Monitor require an agent?
An agent is only required to collect data from the operating system and workloads in virtual machines. The virtual machines can be located in Azure, another cloud environment, or on-premises. See Overview of the Azure Monitor agents.
Firewall requirements
| Agent Resource | Ports | Direction | Bypass HTTPS inspection |
|---|---|---|---|
| *.ods.opinsights.azure.com | Port 443 | Outbound | Yes |
| *.oms.opinsights.azure.com | Port 443 | Outbound | Yes |
| *.blob.core.windows.net | Port 443 | Outbound | Yes |
| *.azure-automation.net | Port 443 | Outbound | Yes |
Azure Monitoring Agent
Why should I migrate from Log Analytics agent (MMA) to AMA?
The AMA replaces the Log Analytics agent, the Azure Diagnostics extension, and the Telegraf Agent. The AMA offers a higher rate of EPS with a lower footprint, providing enhanced filtering features, scalable deployment management and configuration using DCRs and Azure policies.
While the AMA has not yet reached full parity with the MMA, we continue to add features and support and the MMA will be retired on August 31, 2024.
Supported services and features
The following table shows the current support for the Azure Monitor agent with other Azure services.
| Azure service | Current support | More information |
|---|---|---|
| Microsoft Defender for Cloud | Private preview | Sign-up link |
| Microsoft Sentinel | Windows DNS logs: Private previewLinux Syslog CEF (Common Event Format): Private previewWindows Forwarding Event (WEF): Public previewWindows Security Events: Generally available | Sign-up linkSign-up linkNo sign-up neededNo sign-up needed |
The following table shows the current support for the Azure Monitor agent with Azure Monitor features.
| Azure Monitor feature | Current support | More information |
|---|---|---|
| Text logs and Windows IIS logs | Public preview | Collect text logs with Azure Monitor agent (preview) |
| Windows client installer | Public preview | Set up Azure Monitor agent on Windows client devices |
| VM insights | Private preview | Sign-up link |
The following table shows the current support for the Azure Monitor agent with Azure solutions.
| Solution | Current support | More information |
|---|---|---|
| Change Tracking | Supported as File Integrity Monitoring in the Microsoft Defender for Cloud Private Preview. | Sign-up link |
| Update Management | Use Update Management v2 (Private Preview) that doesn’t require an agent. | Sign-up link |
Security
The Azure Monitor agent doesn’t require any keys but instead requires a system-assigned managed identity. You must have a system-assigned managed identity enabled on each virtual machine before you deploy the agent.
Firewall requirements
| Cloud | Endpoint | Purpose | Port | Direction | Bypass HTTPS inspection |
|---|---|---|---|---|---|
| Azure Commercial | global.handler.control.monitor.azure.com | Access control service | Port 443 | Outbound | Yes |
| Azure Commercial | <virtual-machine-region-name>.handler.control.monitor.azure.com | Fetch data collection rules for specific machine | Port 443 | Outbound | Yes |
| Azure Commercial | <log-analytics-workspace-id>.ods.opinsights.azure.com | Ingest logs data | Port 443 | Outbound | Yes |
| Azure Government | global.handler.control.monitor.azure.us | Access control service | Port 443 | Outbound | Yes |
| Azure Government | <virtual-machine-region-name>.handler.control.monitor.azure.us | Fetch data collection rules for specific machine | Port 443 | Outbound | Yes |
| Azure Government | <log-analytics-workspace-id>.ods.opinsights.azure.us | Ingest logs data | Port 443 | Outbound | Yes |
| Azure China | global.handler.control.monitor.azure.cn | Access control service | Port 443 | Outbound | Yes |
| Azure China | <virtual-machine-region-name>.handler.control.monitor.azure.cn | Fetch data collection rules for specific machine | Port 443 | Outbound | Yes |
| Azure China | <log-analytics-workspace-id>.ods.opinsights.azure.cn | Ingest logs data | Port 443 | Outbound | Yes |
If using private links on the agent, you must also add data collection endpoints.
| Component | Description |
|---|---|
| Configuration access endpoint | The endpoint used to access the configuration service to fetch associated data collection rules (DCR). Example: <unique-dce-identifier>.<regionname>.handler.control |
| Logs ingestion endpoint | The endpoint used to ingest logs to Log Analytics workspace(s). Example: <unique-dce-identifier>.<regionname>.ingest |
| Network Access Control Lists (ACLs) | Network access control rules for the endpoints |
What You should monitor?
From Microsoft Cloud models you can see what is managed by Microsoft, so it gives and layout what should at least be monitored on each model.
You won’t necessarily configure complete monitoring for all of your cloud resources but instead focus on your critical applications and the components they depend on.

Ask yourself the following questions:
- What is the composition of the service? Are those dependencies monitored today? If so, are there multiple tools involved? Is there an opportunity to consolidate, without introducing risks?
- What is the SLA of the service, and how will I measure and report it?
- What should the service dashboard look like when an incident is raised? What should the dashboard look like for the service owner, and for the team that supports the service?
- What metrics does the resource produce that I need to monitor?
- How will the service owner, support teams, and other personnel be searching the logs?
Understand Azure Monitor costs
A core goal of your monitoring strategy will be minimizing costs. Some data collection and features in Azure Monitor have no cost while other have costs based on their particular configuration, amount of data collected, or frequency that they’re run. The articles in this scenario will identify any recommendations that include a cost, but you should be familiar with Azure Monitor pricing as you design your implementation for cost optimization. See the following for details and guidance on Azure Monitor pricing:
Create and customize alert rules by using Azure Monitor
There are multiple types of alert rules defined by the type of data that they use. Each has different capabilities and a different cost. The basic strategy you should follow is to use the alert rule type with the lowest cost that provides the logic that you require.
- Activity log rules. Creates an alert in response to a new Activity log event that matches specified conditions. There is no cost to these alerts so they should be your first choice, although the conditions they can detect are limited. See Create, view, and manage activity log alerts by using Azure Monitor for details on creating an Activity log alert.
- Metric alert rules. Creates an alert in response to one or more metric values exceeding a threshold. Metric alerts are stateful meaning that the alert will automatically close when the value drops below the threshold, and it will only send out notifications when the state changes. There is a cost to metric alerts, but this is often significantly less than log alerts. See Create, view, and manage metric alerts using Azure Monitor for details on creating a metric alert.
- Log alert rules. Creates an alert when the results of a schedule query matches specified criteria. They are the most expensive of the alert rules, but they allow the most complex criteria. See Create, view, and manage log alerts using Azure Monitor for details on creating a log query alert.
- Application alerts allow you to perform proactive performance and availability testing of your web application. You can perform a simple ping test at no cost, but there is a cost to more complex testing. See Monitor the availability of any website for a description of the different tests and details on creating them.
Alert severity
| Level | Name | Description |
|---|---|---|
| Sev 0 | Critical | Loss of service or application availability or severe degradation of performance. Requires immediate attention. |
| Sev 1 | Error | Degradation of performance or loss of availability of some aspect of an application or service. Requires attention but not immediate. |
| Sev 2 | Warning | A problem that does not include any current loss in availability or performance, although has the potential to lead to more sever problems if unaddressed. |
| Sev 3 | Informational | Does not indicate a problem but rather interesting information to an operator such as successful completion of a regular process. |
| Sev 4 | Verbose | Detailed information not useful |
How to?
Open https://portal.azure.com/#blade/Microsoft_Azure_Monitoring/AzureMonitoringBrowseBlade/alertsV2
And choose Create -> Alert rule

Select your subscription and keep Include all future resources. It will include any new resources added to the above resource groups/subscription.

In the next page you can select Signal types. They vary based on the selected target(s). The signal types may be metrics, log search queries or activity logs.

And also select monitored services.

These is currently 6002 different signals to choose from.

And under conditions you can choose severity to alert. When you create a logic, you will see a preview under under the rule

Action groups
Then go Actions, choose an action group (if you have one) or create a new one

Provide an action group name that is unique within the resource group and display name that will be shown as the action group name in email and SMS notifications.

In the notification types you can select how to notify people in the group

If we choose Email ARM roles, you will see the following page. All users with a specific ARM role assignment at the subscription level will be notified

Common alert schema standardizes the consumption experience for alert notifications in Azure today. Historically, the three alert types in Azure today (metric, log, and activity log) have had their own email templates, webhook schemas, etc. With the common alert schema, you can now receive alert notifications with a consistent schema.
| Action | Enhancements |
|---|---|
| A consistent and detailed email template, allowing you to easily diagnose issues at a glance. Embedded deep-links to the alert instance on the portal and the affected resource ensure that you can quickly jump into the remediation process. | |
| Webhook/Logic App/Azure Function/Automation Runbook | A consistent JSON structure for all alert types, which allows you to easily build integrations across the different alert types. |
When you choose Email / SMS rule, you will see the following page
You can only add one email, to add another email address, add another notification. The email can also be a group or a Distribution list
Voice notifications are currently available only for US phone numbers
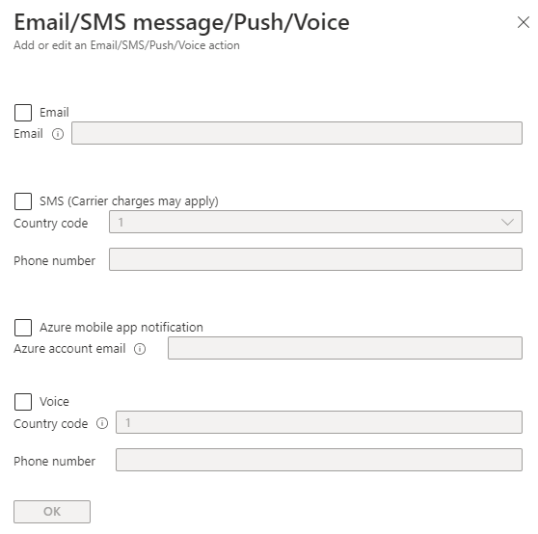
And you can also define the common schema in this notification

So, now you have two notifications

Action types
Still inside the actions, you will have several choices in here but they are optional

Runbook
Select Standard to choose among Microsoft-provided runbooks; select User to choose from runbooks that you created or imported in your Automation account.

Functions
Select a function (only functions with an HTTP trigger are displayed)

Event hub

ITSM
You have to have an connector to create an ITSM ticket

Logic apps
Only Http Request trigger is supported at this time

Secure webhook

Or a normal webhook

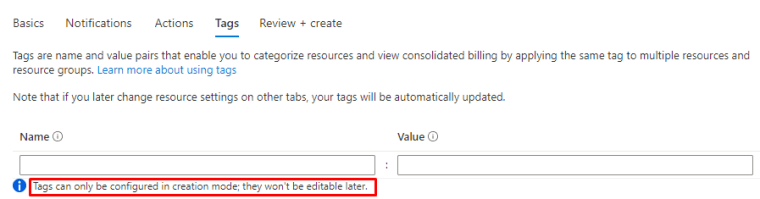
You can create tags but you cannot modify them after creating action group
Now you should be having similar to this one
Just wanted to point out the Test action group feature (still in preview)

With that one you can select a sample payload that will be sent to the selected actions. The sample payload will be sent with the common alert schema for actions with this schema enabled.

Directly from activity logs
You can open Monitor Activity logs and create a alert directly from here

Configure diagnostic logging and log retention by using Azure Monitor
For this job we have Log analytics
Azure services require Azure Monitor to collect telemetry, and it’s enabled the moment that you create an Azure subscription. The Activity log is automatically collected for the subscription, and platform metrics are automatically collected from any Azure resources you create. You can immediately start using metrics explorer, which is similar to performance views in the Operations console, but it provides interactive analysis and advanced aggregations of data.
Platform metrics are sent automatically to Azure Monitor Metrics by default and without configuration.
Platform logs provide detailed diagnostic and auditing information for Azure resources and the Azure platform they depend on.
- Resource logs are not collected until they are routed to a destination.
- The Activity Log exists on its own but can be routed to other locations.
Each Azure resource requires its own diagnostic setting, which defines the following criteria:
- Sources – The type of metric and log data to send to the destinations defined in the setting. The available types vary by resource type.
- Destinations – One or more destinations to send to.
Destinations
Platform logs and metrics can be sent to the destinations in the following table.
| Destination | Description |
|---|---|
| Log Analytics workspace | Metrics are converted to log form. This option may not be available for all resource types. Sending them to the Azure Monitor Logs store (which is searchable via Log Analytics) helps you to integrate them into queries, alerts, and visualizations with existing log data. |
| Azure storage account | Archiving logs and metrics to an Azure storage account is useful for audit, static analysis, or backup. Compared to Azure Monitor Logs and a Log Analytics workspace, Azure storage is less expensive and logs can be kept there indefinitely. |
| Event Hubs | Sending logs and metrics to Event Hubs allows you to stream data to external systems such as third-party SIEMs and other Log Analytics solutions. |
| Azure Monitor partner integrations | Specialized integrations between Azure Monitor and other non-Microsoft monitoring platforms. Useful when you are already using one of the partners. |
Destination limitations
| Destination | Requirements |
|---|---|
| Log Analytics workspace | The workspace does not need to be in the same region as the resource being monitored. |
| Azure storage account | Do not use an existing storage account that has other, non-monitoring data stored in it so that you can better control access to the data. If you are archiving the Activity log and resource logs together though, you may choose to use the same storage account to keep all monitoring data in a central location. To send the data to immutable storage, set the immutable policy for the storage account as described in Set and manage immutability policies for Blob storage. You must follow all steps in this linked article including enabling protected append blobs writes. The storage account needs to be in the same region as the resource being monitored if the resource is regional. |
| Event Hubs | The shared access policy for the namespace defines the permissions that the streaming mechanism has. Streaming to Event Hubs requires Manage, Send, and Listen permissions. To update the diagnostic setting to include streaming, you must have the ListKey permission on that Event Hubs authorization rule. The event hub namespace needs to be in the same region as the resource being monitored if the resource is regional. Diagnostic settings can’t access Event Hubs resources when virtual networks are enabled. You have to enable the Allow trusted Microsoft services to bypass this firewall setting in Event Hub, so that Azure Monitor (Diagnostic Settings) service is granted access to your Event Hubs resources. |
| Partner integrations | Varies by partner. Check the Azure Monitor partner integrations documentation for details. |
Log Analytics

Cost
There is no direct cost for creating or maintaining a workspace. You’re charged for the data sent to it (data ingestion) and how long that data is stored (data retention). These costs may vary based on the data plan of each table as described below.
| Category | Analytics Logs | Basic Logs |
|---|---|---|
| Ingestion | Cost for ingestion. | Reduced cost for ingestion. |
| Log queries | No additional cost. Full query capabilities. | Additional cost. Subset of query capabilities. |
| Retention | Configure retention from 30 days to 730 days. | Retention fixed at 8 days. |
| Alerts | Supported. | Not supported. |
Data retention and archive
Data in each table in a Log Analytics workspace is retained for a specified period of time after which it’s either removed or archived with a reduced retention fee. Set the retention time to balance your requirement for having data available with reducing your cost for data retention.

To access archived data, you must first retrieve data from it in an Analytics Logs table using one of the following methods:
| Method | Description |
|---|---|
| Search Jobs | Retrieve data matching particular criteria. |
| Restore | Retrieve data from a particular time range. |

How to?
You can use Log analytics to retain logs longer than 90days. By default it isn’t enabled.

To enable open Diagnostics settings and add a diagnostics setting
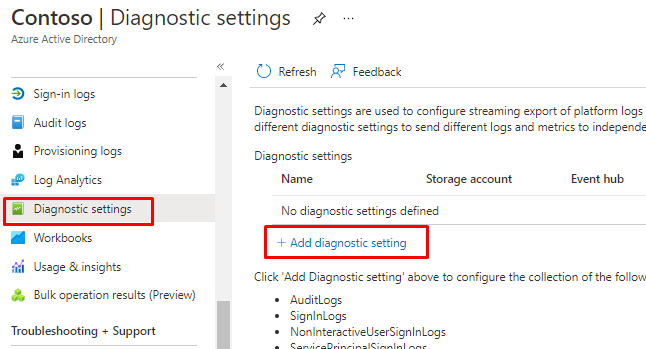
From here You can add both logs to Log analytics or archive them to and Storage account.

When You choose either one, you don’t have any limit on the retention.

Monitor security logs by using Azure Monitor
There are two ways you can collect Security events using the new agent, when sending to a Log Analytics workspace:
- You can use AMA to natively collect Security Events, same as other Windows Events. These flow to the ‘Event’ table in your Log Analytics workspace.
- If you have Sentinel enabled on the workspace, the Security Events flow via AMA into the ‘SecurityEvent’ table instead (same as using Log Analytics Agent). This will always require the solution to be enabled first.
Monitoring security logs has a similar process than with other logs, when you create alert rule, you will choose security
Creating alerts

Once create, you will find the rule under Alert rules

Virtual machines
Azure Monitor focuses on operational data like Activity logs, Metrics, and Log Analytics supported sources, including Windows Events (excluding security events), performance counters, logs, and Syslog. Security monitoring in Azure is performed by Microsoft Defender for Cloud and Microsoft Sentinel. These services each have additional cost, so you should determine their value in your environment before you implement them.
Integration with Azure Monitor
| Integration point | Azure Monitor | Microsoft Defender for Cloud | Microsoft Sentinel | Defender for Endpoint |
|---|---|---|---|---|
| Collects security events | X | X | X | |
| Stores data in Log Analytics workspace | X | X | X | |
| Uses Log Analytics agent | X | X | X | X |
Agent deployment
You can configure Defender for Cloud to automatically deploy the Log Analytics agent to Azure virtual machines. While this might seem redundant with Azure Monitor deploying the same agent, you’ll most likely want to enable both because they’ll each perform their own configuration. For example, if Defender for Cloud attempts to provision a machine that’s already being monitored by Azure Monitor, it will use the agent that’s already installed and add the configuration for the Defender for Cloud workspace.
Create and customize alert rules in Microsoft Sentinel
First you have to provision Sentinel, you can do it from here https://portal.azure.com/#blade/HubsExtension/BrowseResource/resourceType/microsoft.securityinsightsarg%2Fsentinel
There is a 31-day free trial available to try it out

Choose your Log analytics workspace

And done

Then open Analytics and Rule templates, choose a rule and Create

In my example I will use a Privilege escalation with PIM and Privileged groups
You will give it a name and select tactics

In the next screen you can see the KQL query Entity mapping. Each mapped entity can identify up to ten entities.
If you still need to use the old version of entity mapping (as long as the new version is still in preview), you can still access it using a feature flag in the URL. Place your cursor between https://portal.azure.com/ and #blade, and insert the text ?feature.EntityMapping=false.
Once the new version of entity mapping is in General Availability, it will no longer be possible to use the old version. It is highly recommended that you migrate your old entity mappings to the new version.

There is also settings for Scheduling and Alert thresholds

And Your can choose to create incidents directly from the Alert rule

From the next screen you can enable automation

Now you should be having a rule similar to this

And from the Analytics page you can see the rule as Scheduled

Configure connectors in Azure Sentinel
Enable Microsoft Sentinel
First you have to enable Microsoft Sentinel and you can do it from

For setup choose the Log analytics that we provisioned in the last steps. You can get a free trial for 31 days.


Once done, open Sentinel by clicking the name of Log analytics

And you will the you have free trial activated, 10gb for free per day!

And we will see the data populating thru Log analytics

In the connectors page you can see currently only Azure AD

Agent-based integration
Microsoft Sentinel can use the Syslog protocol to connect via an agent to any data source that can perform real-time log streaming. For example, most on-premises data sources connect via agent-based integration.
The following sections describe the different types of Microsoft Sentinel agent-based data connectors. Follow the steps in each Microsoft Sentinel data connector page to configure connections using agent-based mechanisms.
For a complete listing of firewalls, proxies, and endpoints that connect to Microsoft Sentinel through CEF or Syslog, see the data connectors reference.
Syslog
You can stream events from Linux-based, Syslog-supporting devices into Microsoft Sentinel by using the Log Analytics agent for Linux, formerly called the OMS agent. The Log Analytics agent is supported for any device that allows you to install the Log Analytics agent directly on the device.
Common Event Format (CEF)
Log formats vary, but many sources support CEF-based formatting. The Microsoft Sentinel agent, which is actually the Log Analytics agent, converts CEF-formatted logs into a format that Log Analytics can ingest.
For data sources that emit data in CEF, set up the Syslog agent and then configure the CEF data flow. After successful configuration, the data appears in the CommonSecurityLog table.
Custom logs
Some data sources have logs available for collection as files on Windows or Linux. You can collect these logs by using the Log Analytics custom log collection agent.
Follow the steps in each Microsoft Sentinel data connector page to connect using the Log Analytics custom log collection agent. After successful configuration, the data appears in custom tables.
For US GOV customers
Evaluate alerts and incidents in Azure Sentinel
Prerequisites
- You’ll only be able to investigate the incident if you used the entity mapping fields when you set up your analytics rule. The investigation graph requires that your original incident includes entities.
- If you have a guest user that needs to assign incidents, the user must be assigned the Directory Reader role in your Azure AD tenant. Regular (non-guest) users have this role assigned by default.
Simulating data with Azure Sentinel Training Lab environment
If you training and you want to simulate content for Sentinel, you could use example Microsoft’s own Azure Sentinel Training Lab environment
What does it include?
This training package includes pre-recorded data that will be ingested into the selected Microsoft Sentinel Workspace. Don’t worry about ingestion costs, the sample data is only 20 MBs in size! This pre-recorded data will land in the following custom log tables: SecurityEvent_CL, SigninLogs_CL, OfficeActivity_CL, AzureActivity_CL, Cisco_Umbrella_dns_CL.
On top of this ingested data, the solution deploys several artifacts to simulate scenarios that showcase various Microsoft Sentinel features. These artifacts are:
- 3 x Analytics Rules
- 2 x Hunting queries
- 2 x Parsers
- 1 x Workbook
- 1 x Playbook
How to?

Choose your Log analytics workspace

Give a name for the Investigations insights

So cool

and define a Playbook name

Before creating the rule it will ask for Your real email and phone number, no worries, you won’t be billed, yet.

And let the provisioning begin

Analyzing the incidents
And now I have home made incidents inside my Sentinel. Looks bad but feels good.
First from the Overview screen you can see the incidents and open recent incidents

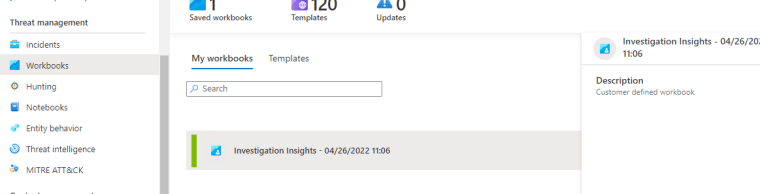
You can also see those incidents from Workbooks

And from incidents, click the incident and View full details

From action you can do the following, creating a Teams channel is really cool. This ways You could collaborate with the whole responsive team.

Collaborate in Microsoft Teams (Preview)
Required permissions
In order to create teams from Microsoft Sentinel:
- The user creating the team must have Incident write permissions in Microsoft Sentinel. For example, the Microsoft Sentinel Responder role is an ideal, minimum role for this privilege.
- The user creating the team must also have permissions to create teams in Microsoft Teams.
- Any Microsoft Sentinel user, including users with the Reader, Responder, or Contributor roles, can gain access to the created team by requesting access.
Settings for your incident team
- Team name: Automatically defined as the name of your incident. Modify the name as needed so that it’s easily identifiable to you.
- Team description: Enter a meaningful description for your incident team.
- Add groups and members: Select one or more Azure AD users and/or groups to add to your incident team. As you select users and groups, they will appear in the Selected groups and users: list below the Add groups and members list.

Investigate
When you choose Investigate, you will a graphical presentation to visualize the threat

Queries
And if you click on the Entities in the upper left, it will open the query window and how the entities in the logs

If compare the KQL query to the results, it will be easy see what KQL part gets what info
And if You want to learn more KQL, You really should check out Rod Trent’s GitHub repository. After reading the sections, I promise you will do how KQL works!
Entity behavior analytics
You can also enable Entity behavior analytics

And Set UEBA

Alerts
Alerts can be found under Workbooks
and under the alerts you can see the Entities and their types

Or from the main screen, click the incident and you can see the alerts from here and also the timeline for the alerts

MITRE ATT&CK
MITRE ATT&CK is a publicly accessible knowledge base of tactics and techniques that are commonly used by attackers, and is created and maintained by observing real-world observations. Many organizations use the MITRE ATT&CK knowledge base to develop specific threat models and methodologies that are used to verify security status in their environments.
Microsoft Sentinel analyzes ingested data, not only to detect threats and help you investigate, but also to visualize the nature and coverage of your organization’s security status.

How to try out Red Team style?
Things to remember
Azure monitor
What products can you integrate?
What are the Azure supported services?
Log Analytics agent (MMA) migration to AMA
What you should monitor and the alert severity
You can only add one email, to add another email address, add another notification. The email can also be a group or a Distribution list
Different actions types and what they do
Log analytics
How Log analytics work?
How to enable
Destinations and their limits
Sentinel
How to provision Sentinel
How KQL language works
How to find incidents and alerts
How to use data connectors
How get content from CEF, Syslog or Custom logs
KQL, KQL and KQL. Learn it, today.
 RSS - Posts